
While your baby’s weight gain is not the only reliable indicator of health and development, it is important. Pediatricians use the World Health Organization’s guidelines to keep track. Let’s learn more.
Babies, like adults, come in many different packages. Gender, nutrition, environment, and quality of medical care are some of the factors that determine their overall size and growth rate [1]. That is why babies of the same age can be very different from each other. So, how do doctors determine if a child is developing well and getting enough to eat? By marking the baby’s weight on a special chart and looking at how their numbers compare with the statistical average.
The charts issued by the WHO are used by pediatricians worldwide. No matter what country the child was born in, the growth rate of all healthy, full-term children is roughly the same. Gender is an important matter when it comes to sizes, so there are different charts for boys and girls [2].
How can I use the WHO chart?
First, you have to weigh your baby and place a dot on the chart where their age and weight meet. With each month’s measurement, a curved line will emerge tracing your baby’s weight gain and showing how they are growing.
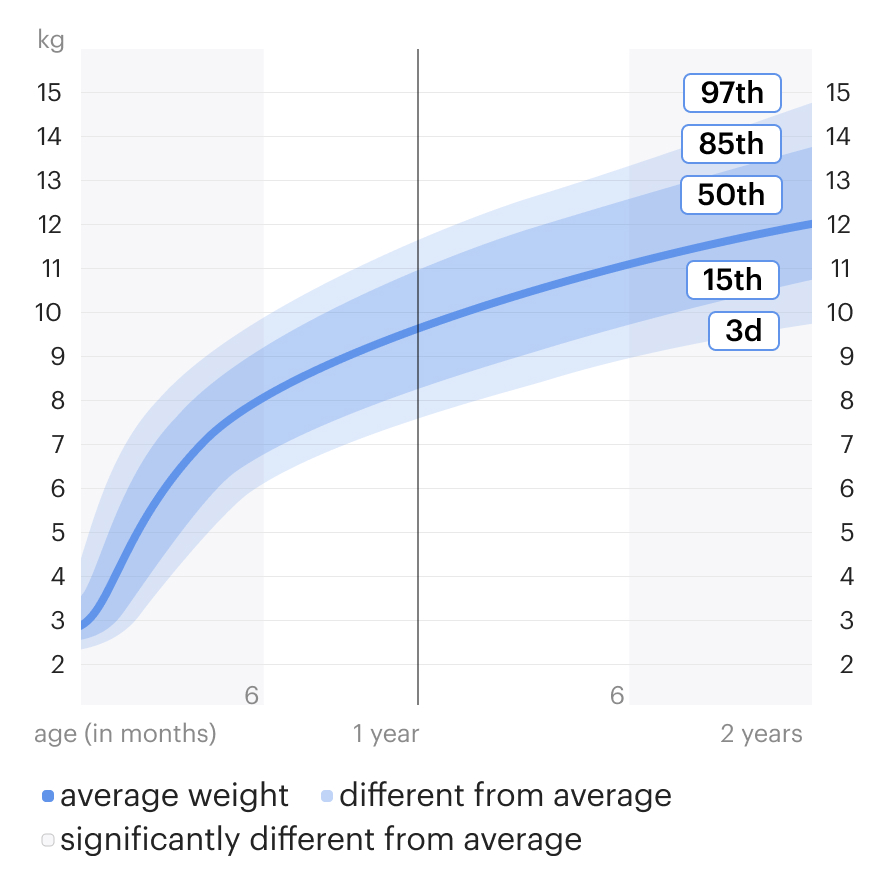
The next step is to correlate your baby's weight with that of other babies. The chart has pre-traced centile lines that show how many children (of the same gender and age) share a particular weight.
If your baby’s dot is close to the green line, it means that their weight is within average parameters.
The higher the dot is from the green line, the larger your baby is in relation to most children of the same age and sex.
The lower the dot is on the chart, the smaller your baby is relative to others.
All babies whose weight falls in the space between the upper and lower lines are considered to be within a normal range. If the dots fall outside the red lines, you should talk about it with your doctor.
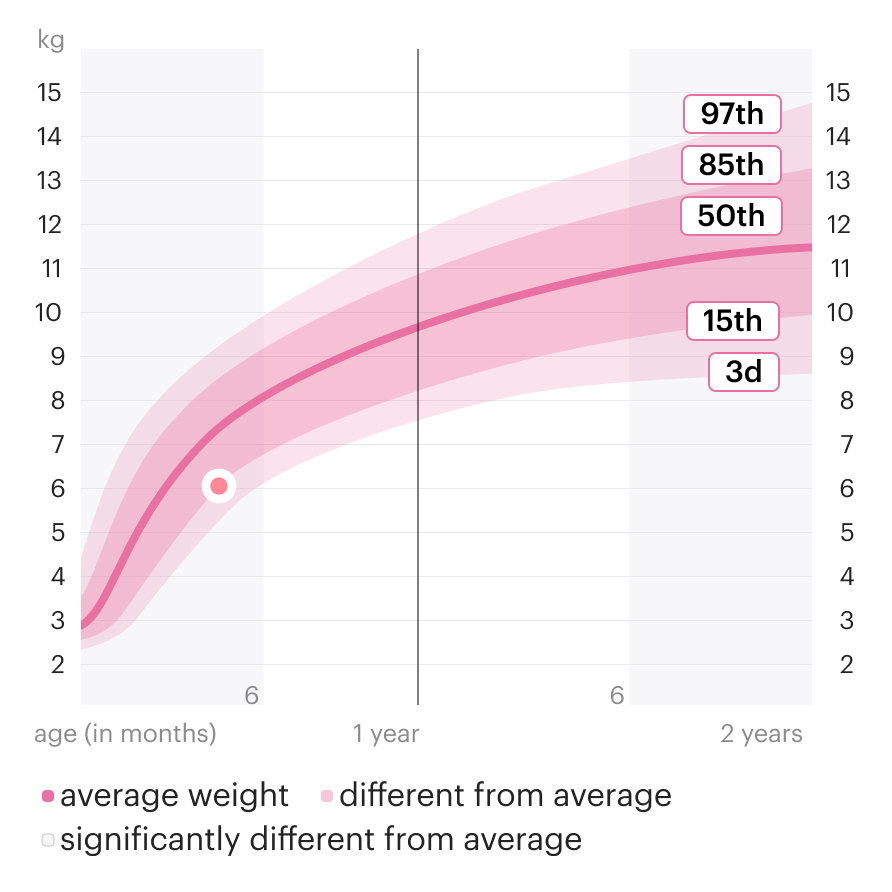
Example
At four months of age, a baby girl weighs 5.6 kg (12 pounds 5 ounces). In the diagram, the convergence point will be close to the bottom orange line. This means that 15% of other girls weigh less and 85% weigh more. Even though she is on the smaller side, her weight is within acceptable values.
Keep in mind that it is important to assess not only your child’s current indicators but also any changes that may come up. Any baby that presents sudden or strong deviations in their curve, like a sharp increase or decrease in weight, should be evaluated by their doctor.
You can track your baby's growth by using the WHO charts in our appendix. You just need to register their weight and the date of measurement. Once you enter these numbers, the program will automatically place a dot on the diagram corresponding to your baby’s weight and compare it with the average statistical data. Gradually, your baby’s growth curve will be drawn with every new entry.